
Business Intelligence
TURN YOUR DATA INTO
YOUR GREATEST COMPETITIVE ADVANTAGE
Our Business Intelligence Solution transforms your company’s fragmented data points into a strategic powerhouse. Through an Intuitive GUI & Dashboards, we don’t just show you what happened; we show you exactly what to do next to scale your revenue and sharpen your strategy.
We Analyze the “Why” Behind the “What”
Before we build your solution, we dig deep into the metrics that actually move the needle:
- Competitor Analysis: Know exactly where you stand and where your rivals are vulnerable.
- Distribution vs. Sales Mapping: Identify where your product is sitting on shelves versus where it’s flying off them.
- Behavior & Spending Trends: Decode the DNA of your customers’ purchasing habits.
- Market Trends Changing: Stay ahead of shifting trends and create opportunity from it.
- Sentiment Analysis: Hear what your customers are really saying about your brand and service.
Transform Insight into Impact
Our BI solutions are more than just software—they are a Management Decision Support System. We empower your leadership team to stop reacting to the past and start focusing on Strategy, Boosting Sales, and Peak Performance.
Data is the new oil, but intelligence is the engine
– Let us build the engine that drives your company forward.
THE ALL-IN-ONE
INTELLIGENCE HUB
We turn these complex data points into a high-performance Business Intelligence Suite designed for one purpose: Decision Support.
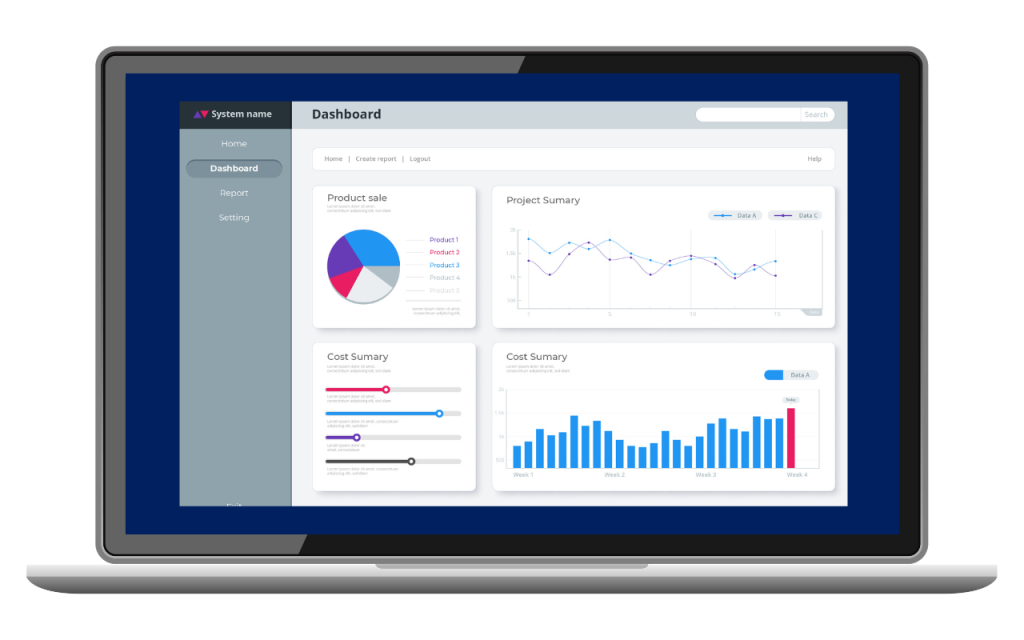
1. The Command Center (Dashboard)
Get a high-level view or a granular deep dive, all in one place.
- Customized Snapshots: Real-time updates for Operations and Sales performance.
- Problem Identification: Instant alerts when metrics dip below target.
- Critical Info: No noise, just the essential data points you need to lead.
2. Simplified KPI Management
We take the complexity out of performance tracking.
- Powerful Logic: Advanced formulas and expressions tailored to your business rules.
- Threshold Alerts: Automated “red-flag” levels so you know exactly when to intervene.
- User-Centric Design: KPIs that are easy to read, track, and understand at a glance.
3. Stunning Visual Analytics
Data is only useful if it’s digestible. Our graphical interfaces are built to impress and inform.
- Eye-Catching Visuals: Move beyond boring spreadsheets with stunning displays.
- Strategic Gauges: Use valuable indicators and gauges for “at-a-glance” status checks.
- Diverse Charting: From pie, trend lines to waterfall charts, we use the right visual for the right data.
4. Predictive Forecasting
Stop looking in the rearview mirror. Our Predictive Analysis uses historical data—sales, pricing, finance, and trends—to model future outcomes.
- Anticipate Demand: Know what will sell before the season starts.
- Price Optimization: Balance your margins with market appetite.